
An Interesting setup going in Hindalco. Every-time when it Breakdown from Symmetrical Triangle, then It move minimum 16%, So recently again there was a Breakdown from Same pattern on 30th July, As per the setup it would touch 160 on or before 16th September 2019. See this is not a technical thing, but interesting, just time pass and when Time pass giving your profit then why not to grab that, And same my system alerting for Rs 160 Target, Might be a coincidence but nice setup. Same Target on both cases.
So this is how whole setup unfolds, first I checked all previous fall, from that i got to know that every time there was a fall from Symmetrical Triangle, and fall ranges in between 16-17% only, so I calculated the Bars from Breakdown of symmetrical Triangle to Bottom so i got below chart. 
Even if we go with Odd & even, then we can say Market will slide 17% now, Because in Previous 3 times market went down by 16%-17%-16% so now again 17%. but till when it will achieve the target, that’s the big Issues right now. So for that We will mark symmetrical triangle as A, B, C, D. From that If we calculate values of A and C then we can say A took 21 Bar for Bottom and C took 32 bars for Bottom ( Bottom after Breakdown from Symmetrical Triangle) & if we apply simple math 32/21= 11, 11/21 = 52% so add 52% to B i.e. 25+52% = 38. So that means D will take 38 Bars to Complete Bottom and 38 bars ends on Monday 16th September 2019.
Here we are calculating Difference of A & C and from that calculation we will add % value to B to get value of D. Like below.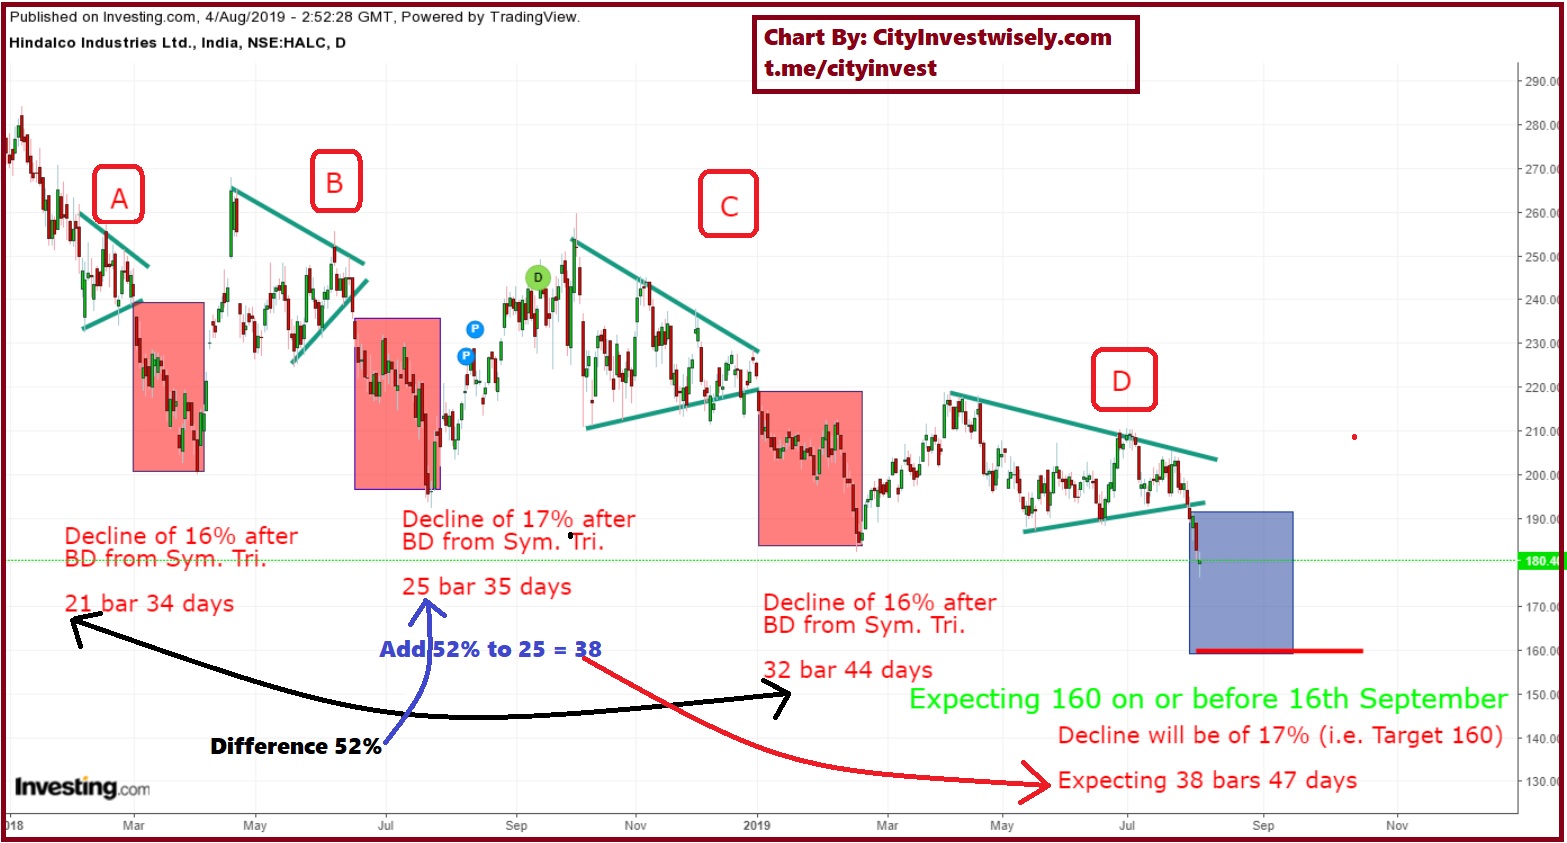 So this is Simple calculation, but there is one more Interesting calculation in this chart, that also indicating Target will get achieve on 16th September 2019. In above charts I took Bars from Breakdown to Bottom, But Now if we check whole time frame, that means starting point of symmetrical triangle and bottom then we will get below chart.
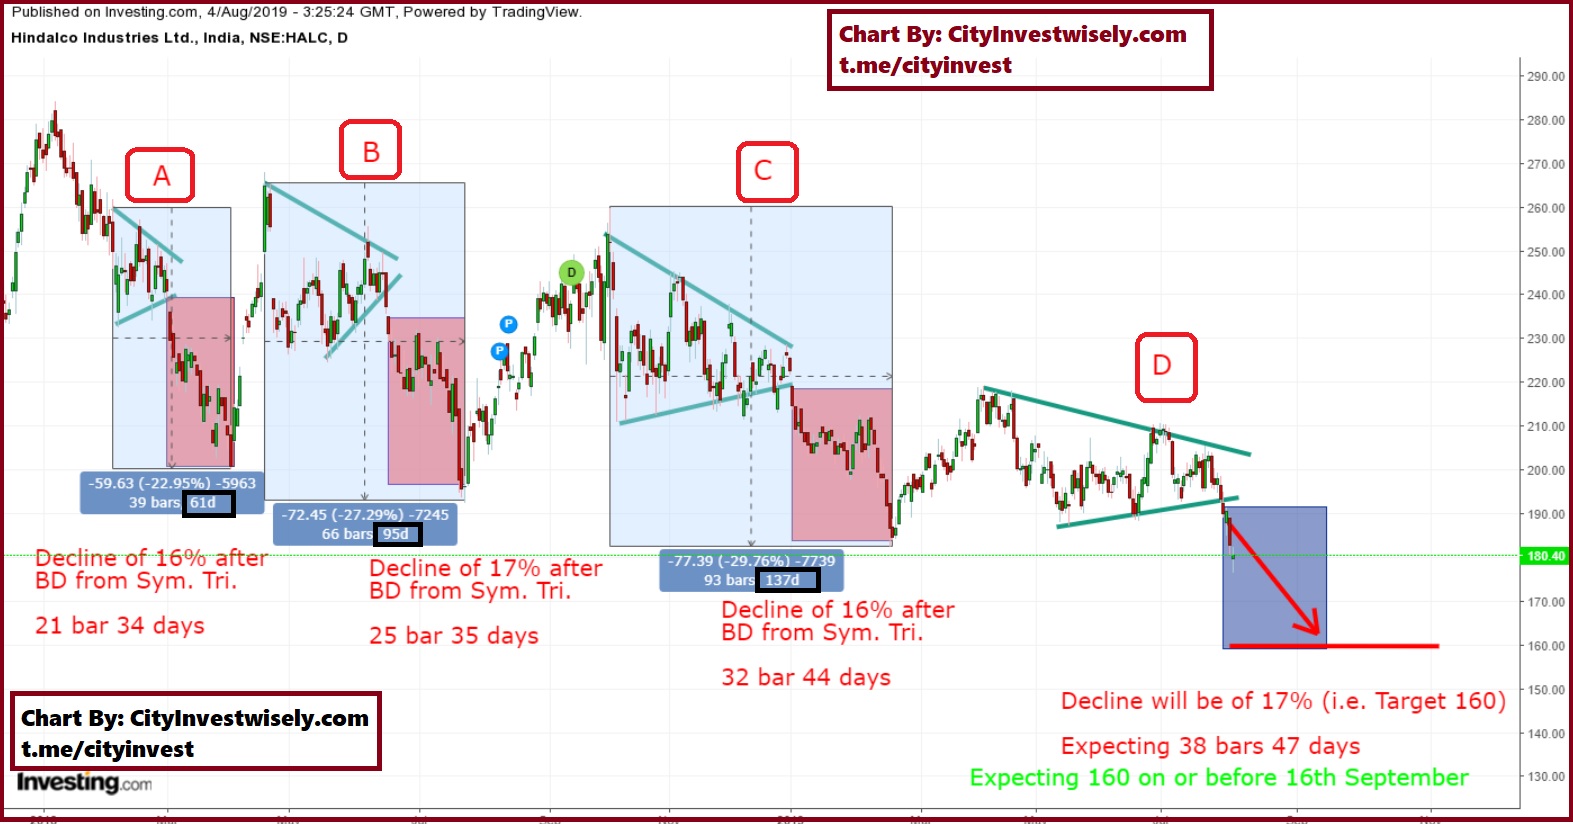 Check Black Marked Rectangle for Calculation of days.A took 61 days, B took 95 days, C took 137 days for whole formation and D ? Do simple Math Like this.
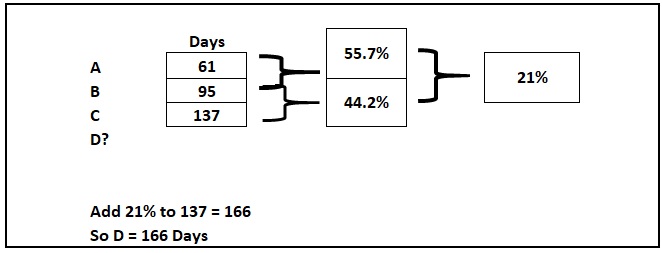
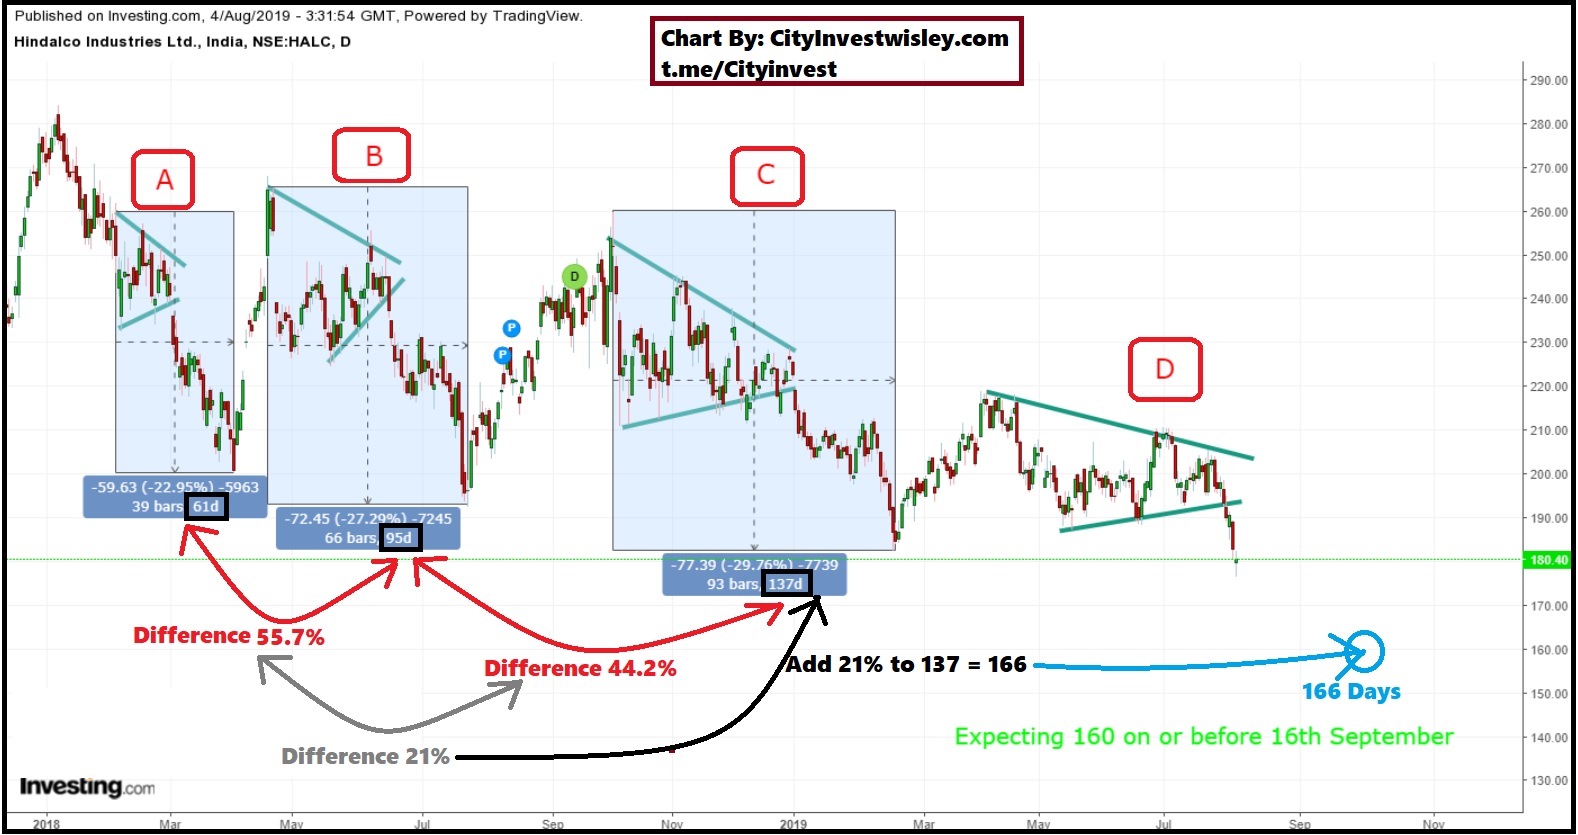 So here is last chart of Hindalco.
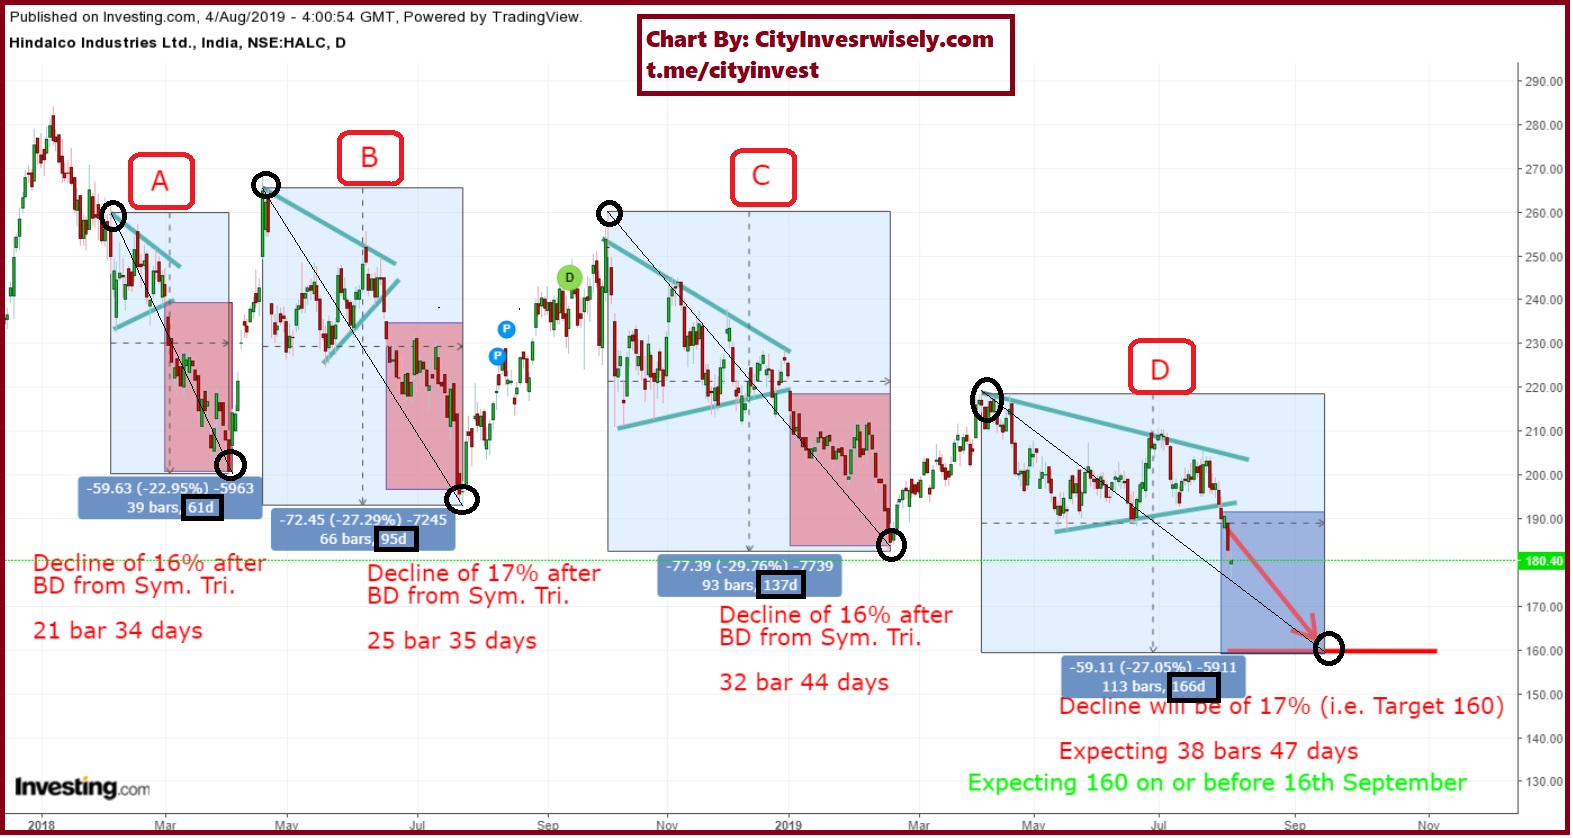 Disclaimer : Stunts performed here is under supervision of Experts, Don’t try this at home. High Stress-full stunt.
New Batch of Technical Analysis Classes for 3 months will start from 24th August 2019, If Interested then click in this Link – Technical Analysis series 5
Other ways to connect with us.
Website : www.cityinvestwisely.com
Facebook Page : https://www.facebook.com/cityinvestmentservices
Telegram Equity Channel : https://t.me/cityinvest
Telegram FNO Channel : https://t.me/cityfno
Telegram Equity Group for Discussion : https://t.me/Stocktalkdiv
Telegram FNO Group for Discussion : https://t.me/Fnotalkdiv
Telegram All world Assets Information : https://t.me/allworldassets
Quora : https://www.quora.com/profile/Divish-Saini-2
Twitter : https://twitter.com/gameoftrend


2 Comments
Nice analysis sir
After reading this one….only one thing comes to my mind, MIND BOGGLING ARTICLE! This really that speaks volume about Divish’s understanding ,not only is this out of the box thinking but also that he has comprehended very well. Superb work….. Hats off to you and seriously I aspire to think like you when it comes to markets! Please keep sharing such amazing mind boggling articles…
Disclaimer to the readers: Read this article at least twice to get a clear understanding !