
Price Wise & Time Wise correction both are bad for a stock or for an Index. Some time a particular stock stuck in both situation, some time whole Index stuck in this situation. In both Corrections stock/Index will adjust/slide as per financial situation of economy.
It’s a very Interesting thing to study in market, like if you focus on major Bear market in history then in 98% of times you will get Both phase of correction. In price correction, first there will be a big slide in price of stock upto 50-75%, and In time correction the stock will stuck in small range for many months & it’s like your stock stuck in a cage.
Basically these kind of Price and Time correction starts only when there is very heavy rally in market, Like with the case of Indian market, we saw very heavy rally in market in 2017, Majorly in Mid-cap and Small caps space, every second share rallied by 150-250 % in span of 14-16 months, Actual Bull market started in June-July 2016 and ended in Jan-Feb 2018.
From Jan 2018 till now it’s been 17-19 months Mid-cap/small-cap are still sliding down, and they will slide for more in next 6-8 months. Don’t expect any recovery in Mid-cap/small-cap, Overall Nifty can bounce a bit but these mid-small can’t.
Some small small bounce will always be there in market, but that will not sustain at higher levels, as we are in 3rd leg of selling, and Time wise correction already started. Overall 3rd Leg selling got delay by 3 months because of Events in market, Earlier I expected 3rd Leg selling by April-May 2019, but due to Budget news Market rallied and 3rd leg got delayed, Now market is moving as per My expectations, which i Already Described in my Article Dated December 17th 2018.That time I said more pain will be there in market and everything is in front of you.
Alerted many time in the past also that I am sitting on cash only from last 12-16 months, I haven’t invested any thing big in market and will not do anything in next 2 quarters also, Continue your SIP, Don’t stop them, that alert is for Direct equity market investment. In this phase your SIP will give you advantage of dollar cost averaging, In falling market you will get more units with the same amount, So grab that, Don’t stop your SIP.
As i said many time Bottom never forms with “V” shape recovery like from this chart you will understand what is “V” shape recovery, it’s a trap in market, New traders will try to take advantage of that “V” shape rally but they will stuck in that stock.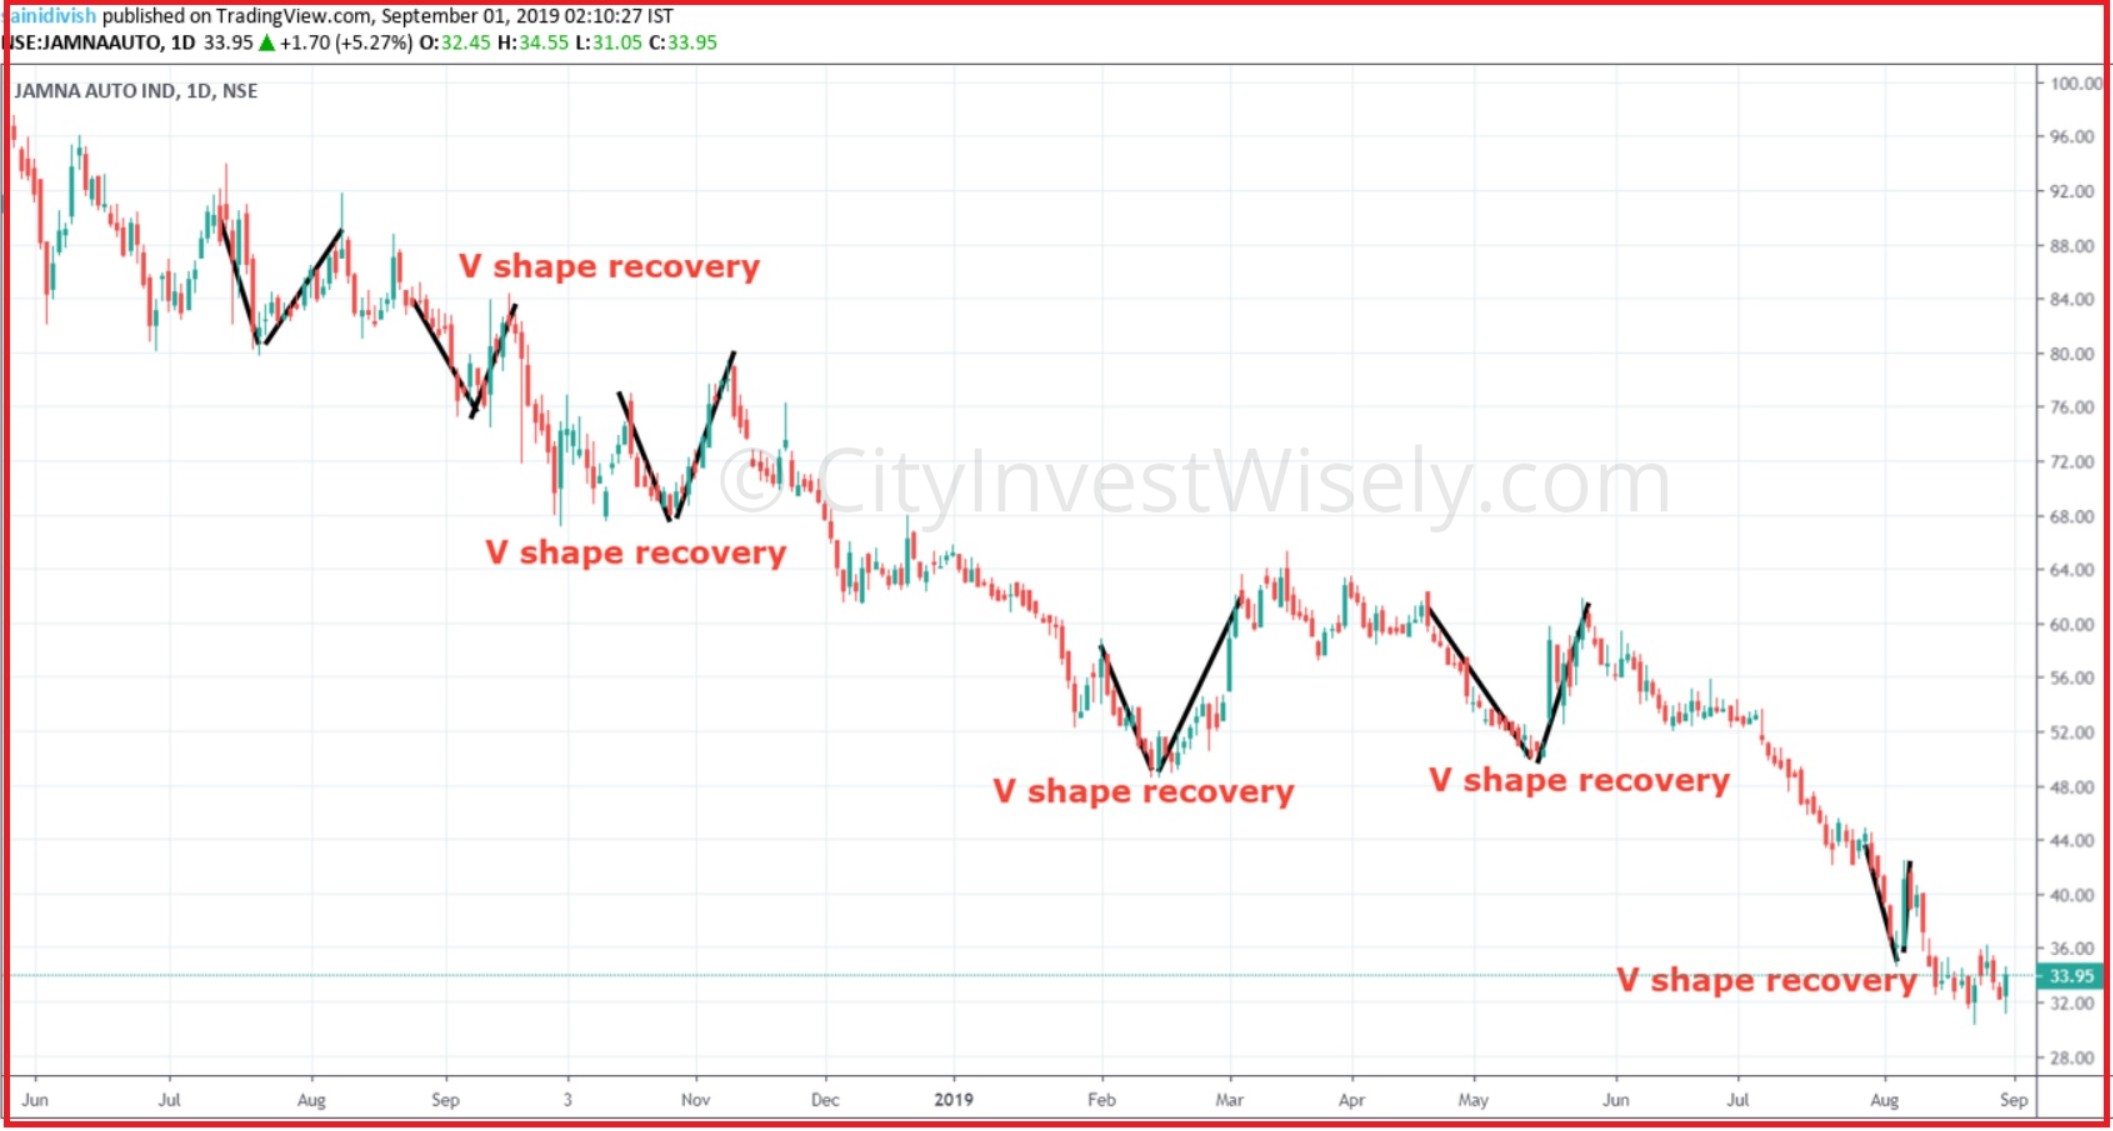 Like the above Jamna Auto share you can search many mid-caps and small-caps you will get nearly same charts, Trap will be there every-time. You can easily play the “V” by checking the long term support of stock and buy and sell quickly to get gain of nearly 6-9%, Like wise same happened in Sterlite Technologies few days back.
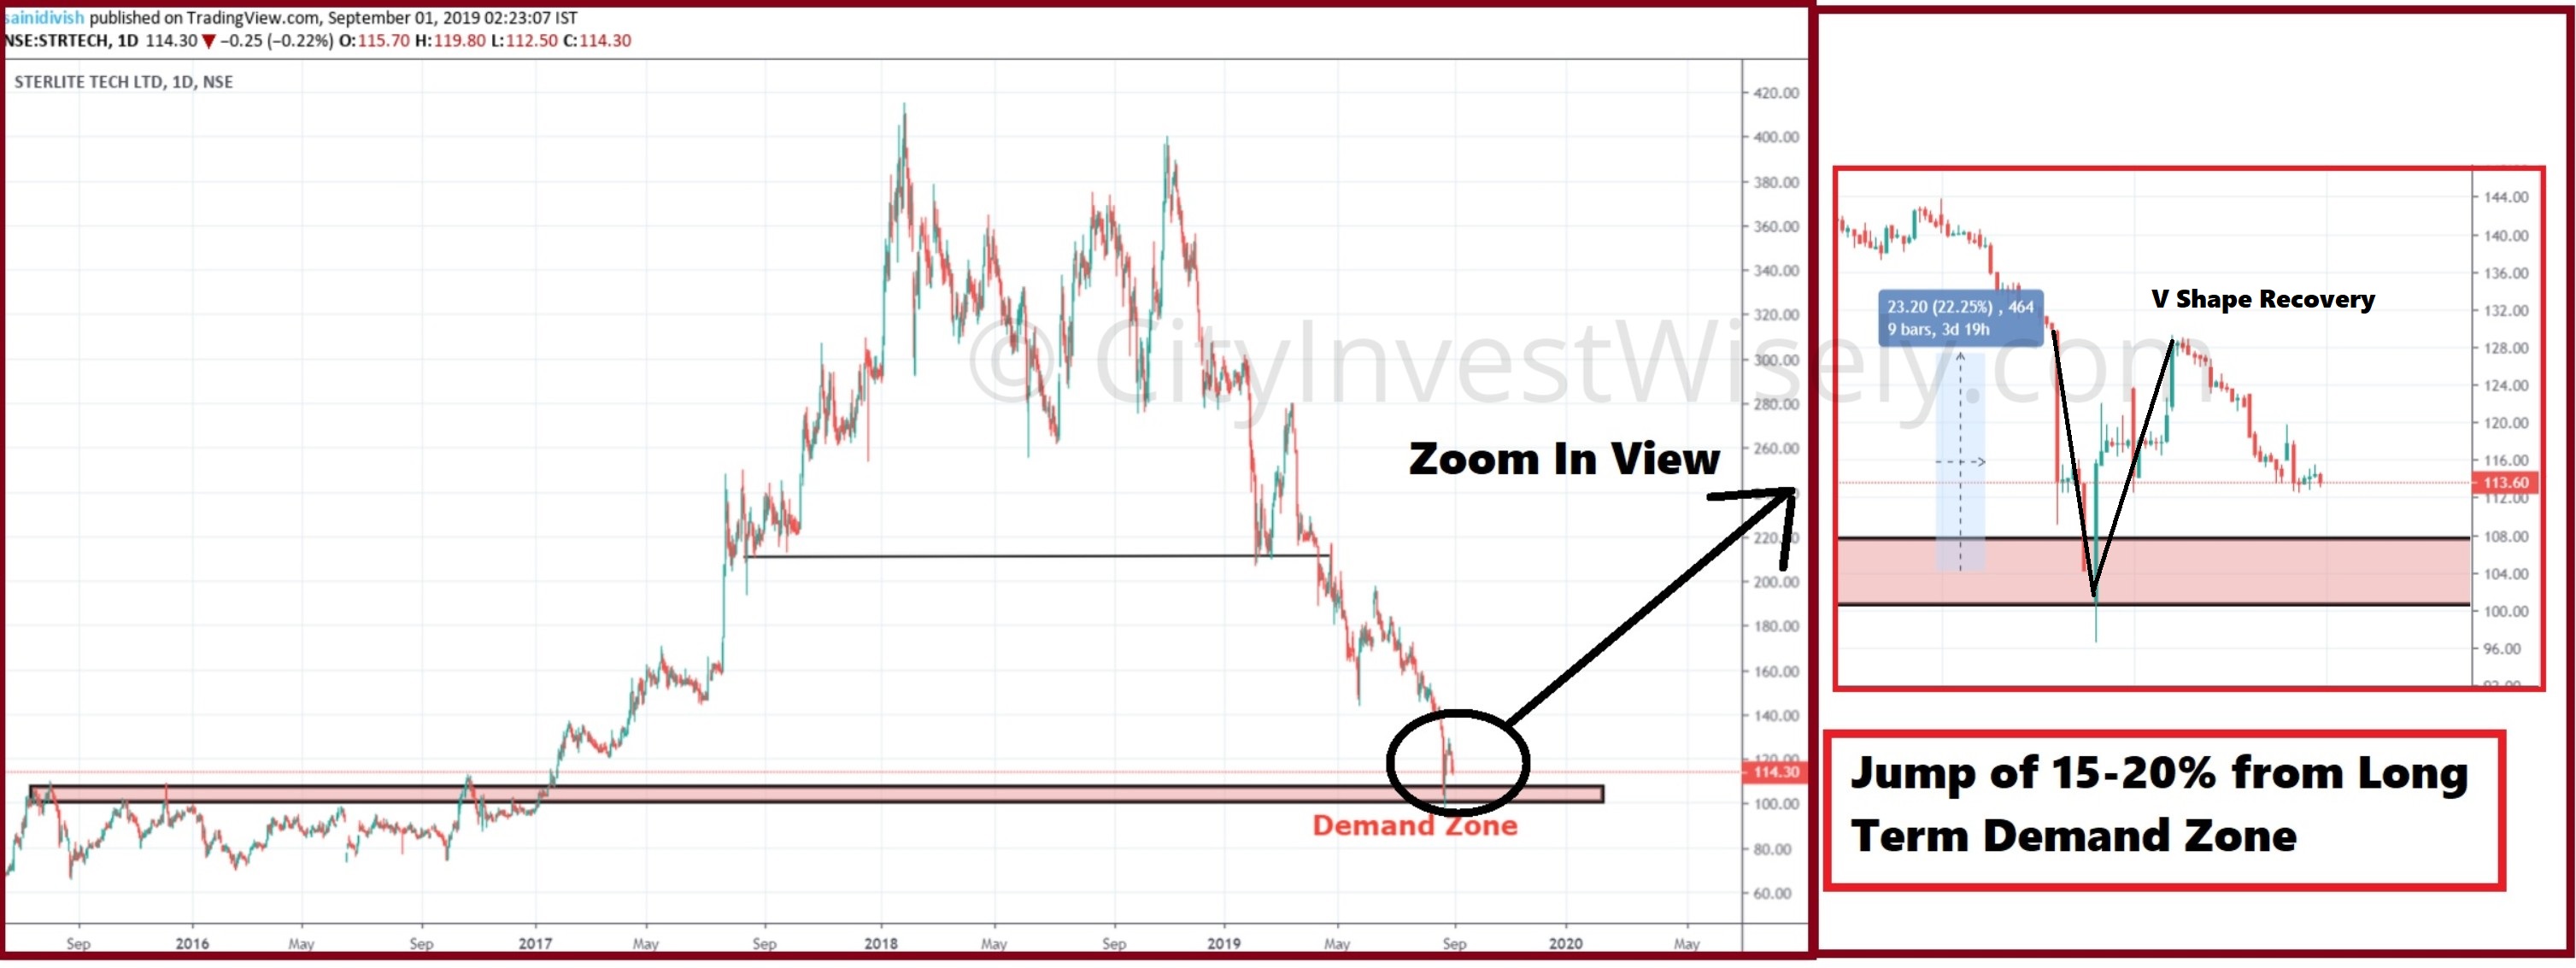
There will be many more “V” shape recovery in market, but all will end in trapping small retailers, But soon the velocity of these fall and rally will slow down, and that will be the starting point of time correction.
Time Correction
Major Price Correction is already done in 80% of Mid-caps and 95% of small-caps, that means price falling 60-85% from the high they hit in the rally of 2017-18. Price and Time correction are different from each other, You can check all difference form this comparison chart.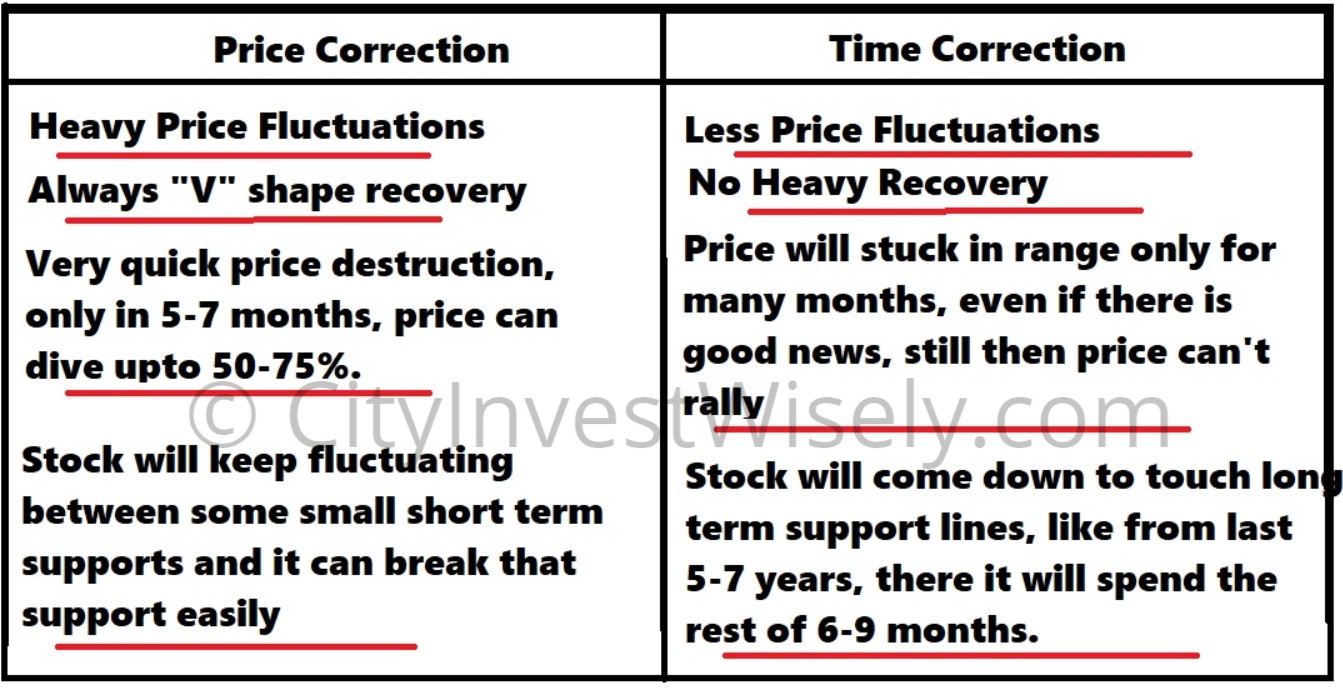 Nifty will fool you by trading at higher levels, Major pain is there in mid-caps and small-caps, After falling very heavily now these shares will try to go into consolidation zone for next 2 quarters ( 2 Minimum time frame, Maximum for 5 quarters). They will try to touch the long term support of shares which is there from last 5-8 years, near at that support they will create a zone and they will keep moving in small zone only for next 2-3 quarters.
Mid-caps/small-caps are very sensitive to economic growth, the movement they get a sign of slowdown or any other bad news regarding the economy, they start falling and keep falling until some strong reforms are not there in the economy. Till now govt. announced some reforms, they are nothing, seriously they are just small, like a particle of salt in front of a big mountain.
For Understanding Time correction you have to check Height and width of rectangle, The moment width phase start expanding and height phase start decreasing that means Time correction starts. You can check the below chart.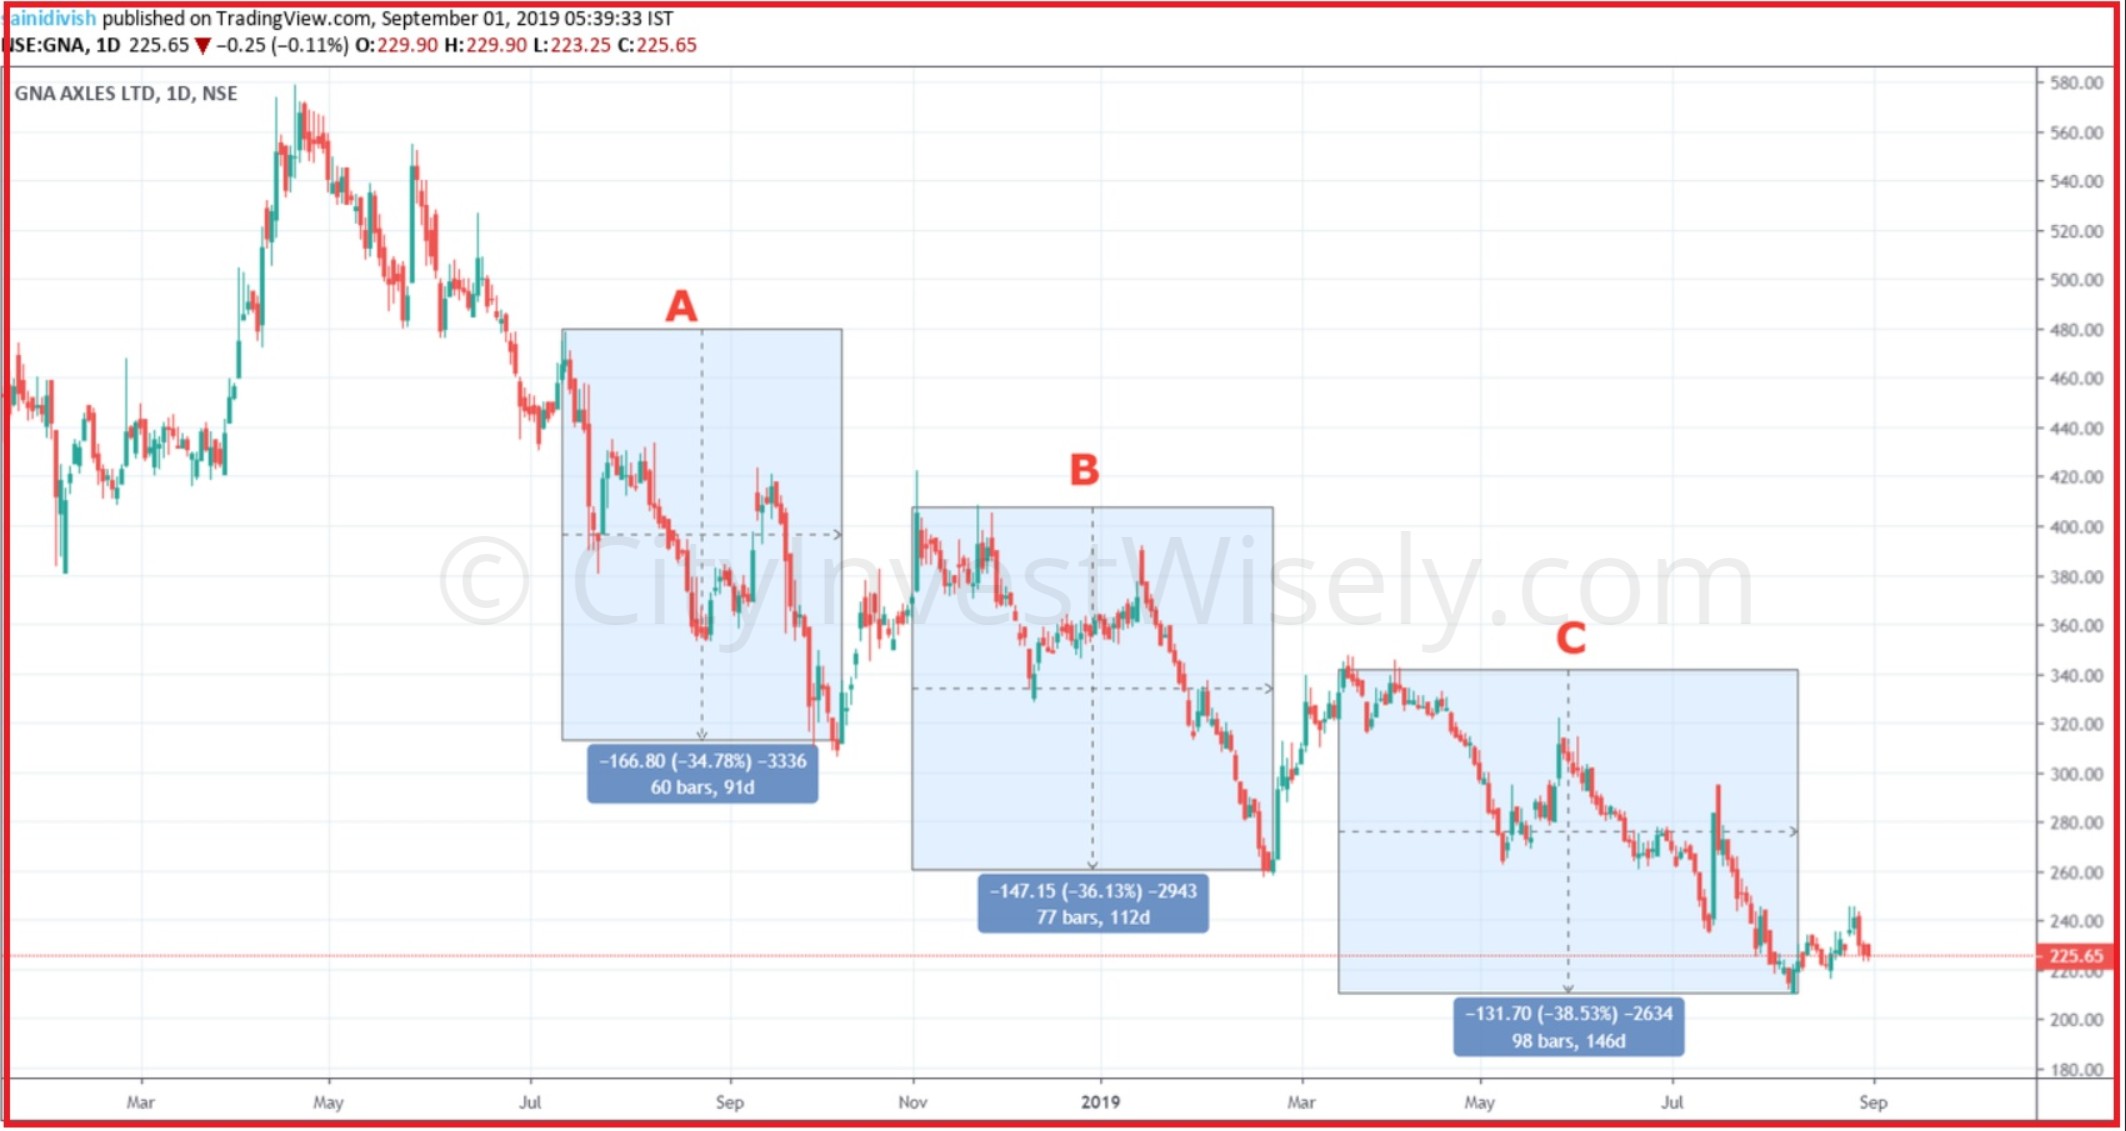
Rectangle A = Big in Height but width wise very less.
Rectangle B = Nearly same in Height of “A” and increase in width as compare to “A”.
Rectangle C = Width expanding as per compare to earlier two rectangles.
From Rectangle C you can understand market is taking more time for the same fall of 35-38%, and in future also it will keep increasing the width of rectangle, that all formation will give you idea about Time correction, your stock will stuck in a cage, with very less fluctuations and that phase is very bad for investors, and that is the last and very hard phase of bear market.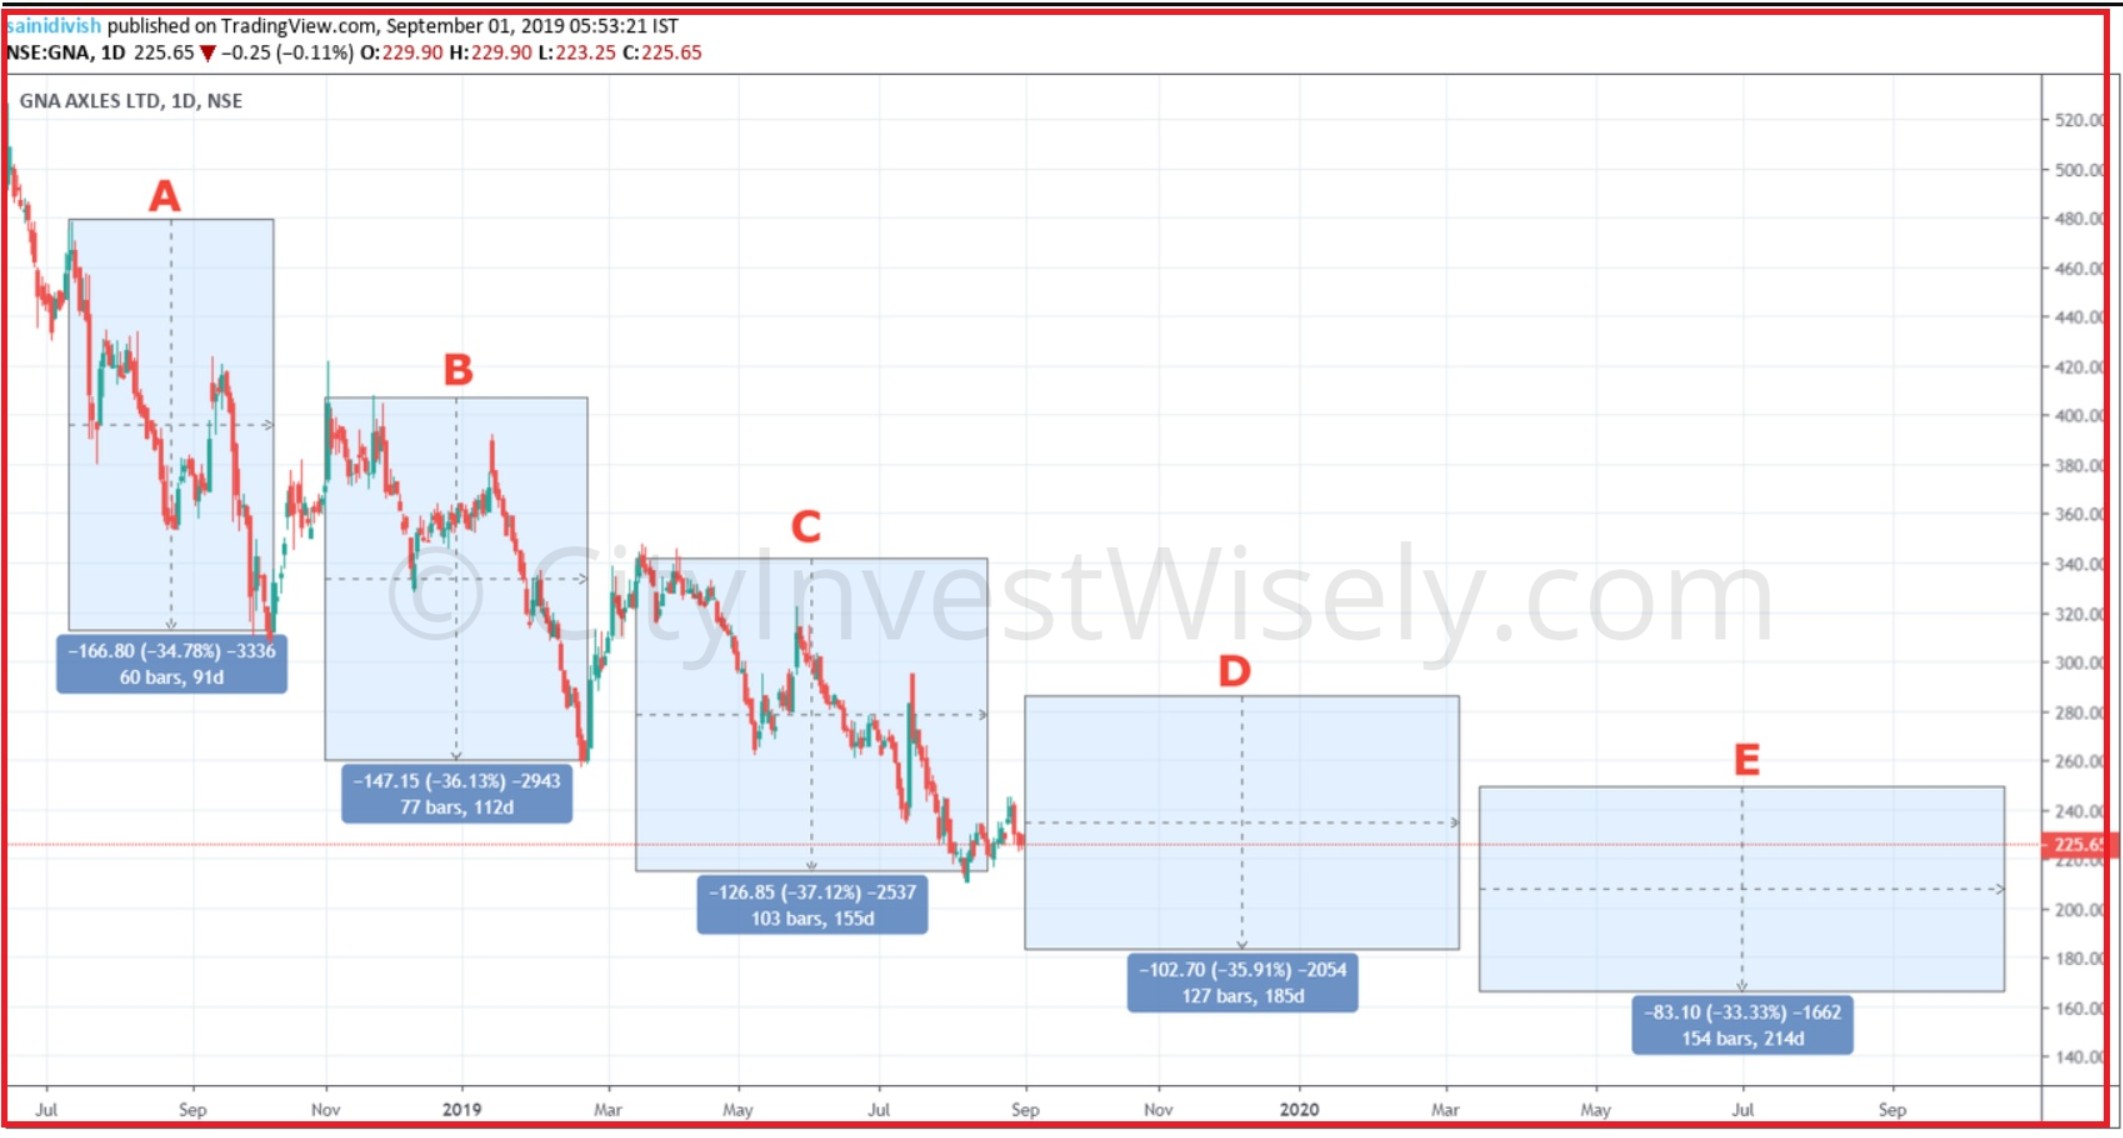 From above chart Rectangle “D” and “E”, you can easily understand how much time it will take for the proper bottom formation, expanding of width of rectangle always painful for investors, and near about the middle part of “E” rectangle heavy panic will be there ( In this panic Nifty also fall heavily), that’s the end of Bear market for Mid-cap/small-caps.
As per my experience Last bottom will be in between months of April-June 2020. And at the bottom a new bull will born. If government fail to deliver the much awaited reforms for the economy then this Bottom dates can delay up-to 1-2 more quarters.
Here you can check the price prediction of next 2 quarters, small range fluctuations and heavy time frame, in the middle of Rectangle “E” it will form the last bottom of Mid-cap/small-cap & that bottom will remain there for next 3-5 years. After that recovery process will start slowly slowly.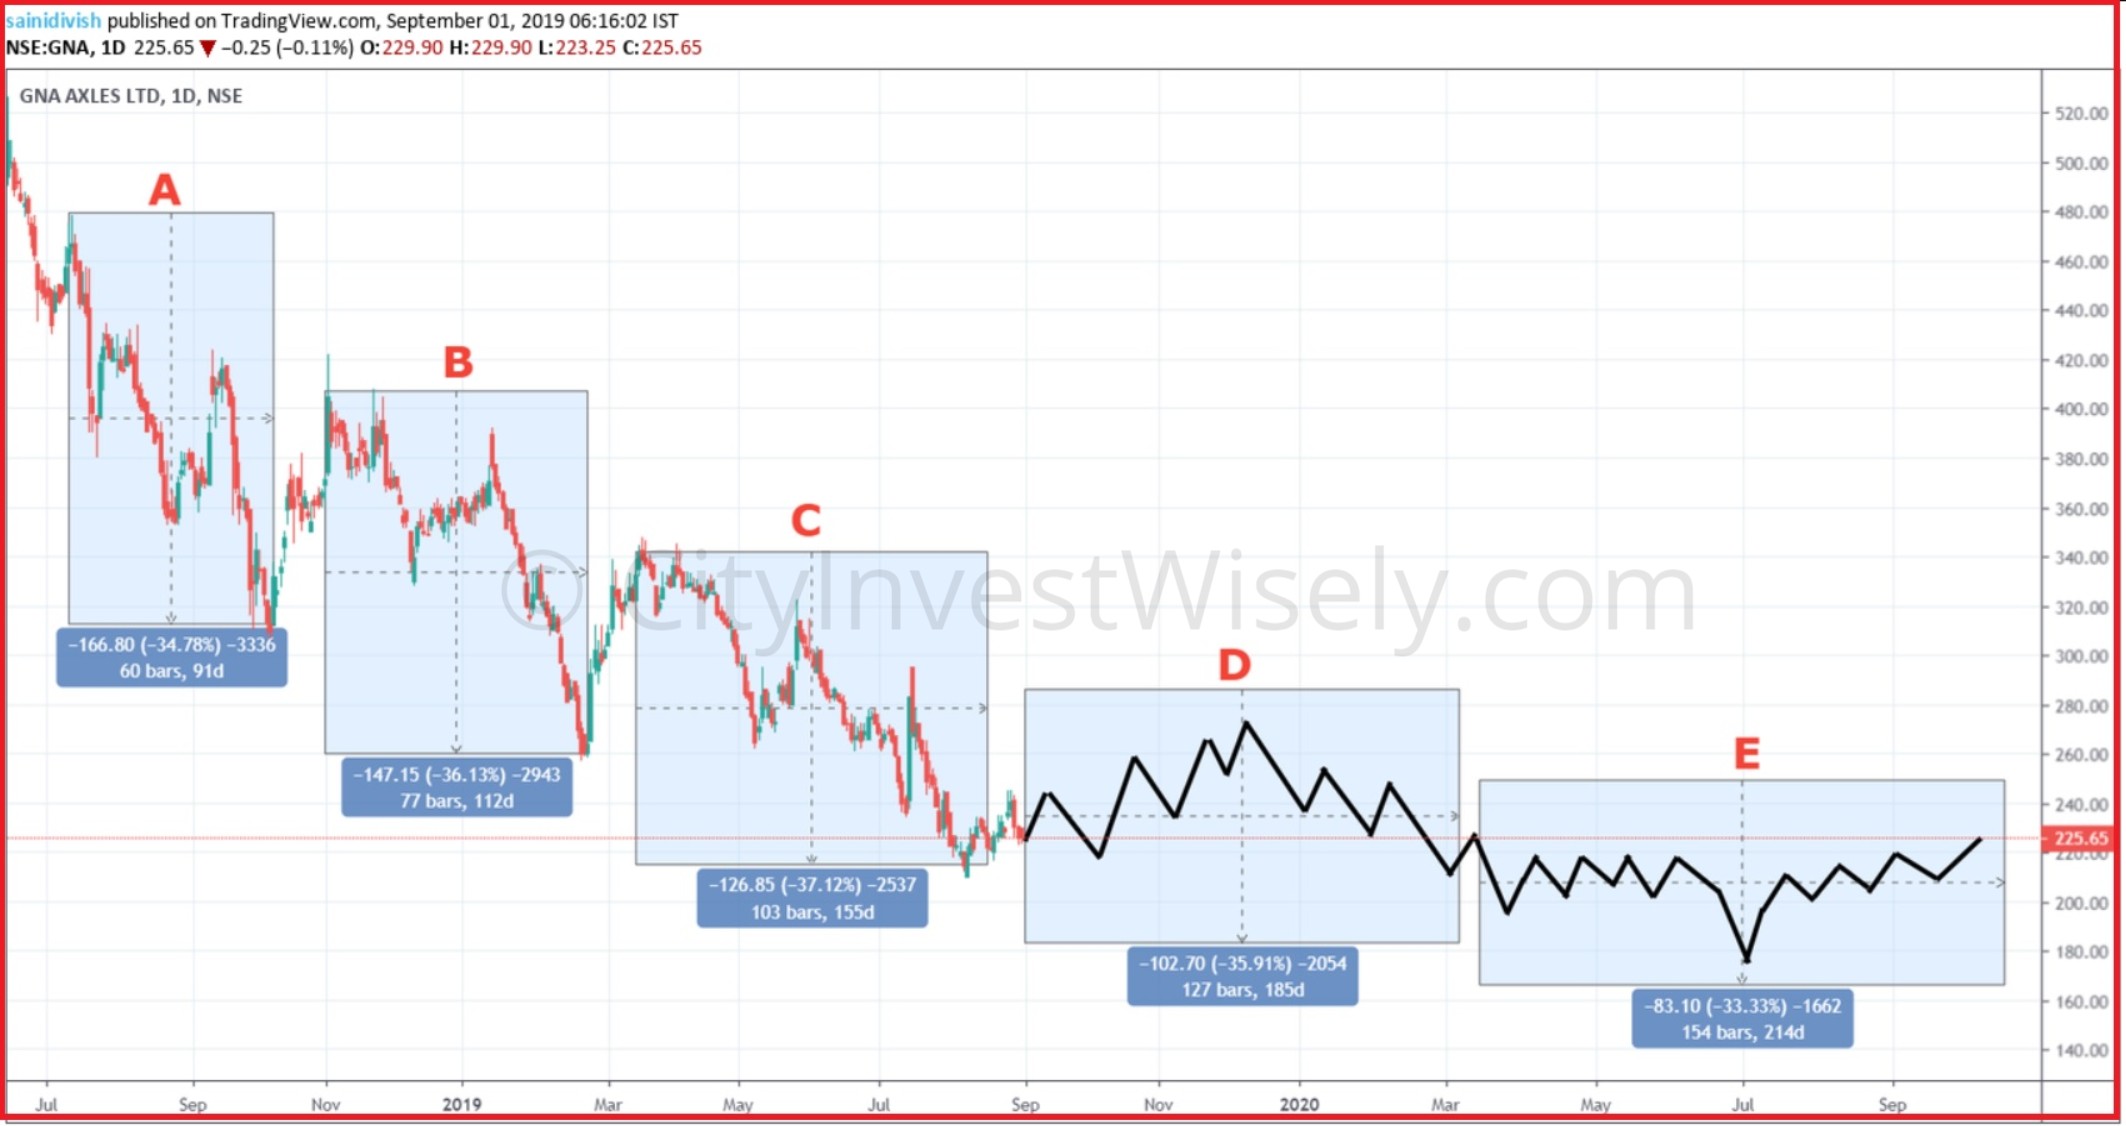
Nifty Road Map Next 2 Quarters
Nifty will not fall much as compare to Mid/small caps, If on global wise everything remain stable then Nifty can bounce uptp 11400-500, but it will not sustain higher levels and again fall from that levels will be there. But the last fall will be same in all Index of Market, In the middle level of “E” Rectangle, Nifty will fall also like 2-4% in sudden panic, may be some kind of domestic or International News. Because as per my analysis, HDFC Bank, HDFC, LT have to hit Bottom levels valuations like which we saw in Feb 2016. That will confirm the Bottom for Indian Market.
Some points to note for next 2 quarters.
- Auto Sales Number will be very scary in September, after that due to festival season some recovery would be there but then again from Jan 2020 again fall in auto number will be there.
- 2-3 Companies to file Bankruptcy in next 2 Quarters & 2-3 Govt. companies to shut down, creating panic in Domestic market.
- More amount of NPA will be there, this time not from Bank, from some other Govt. agencies. Overall Bank will continue to publish more frauds and NPA (Nothing new in that).
- GDP Numbers in November will be in between 4.85-5.25
- Last But not the least
NIFTY will fall 3-5% on Intraday Basis and will close At-least 3% negative may be because of some bad news international or domestic, In last 2-3 years Nifty failed to close below 3% so now time is there, Bear will roar for next 2 quarters.
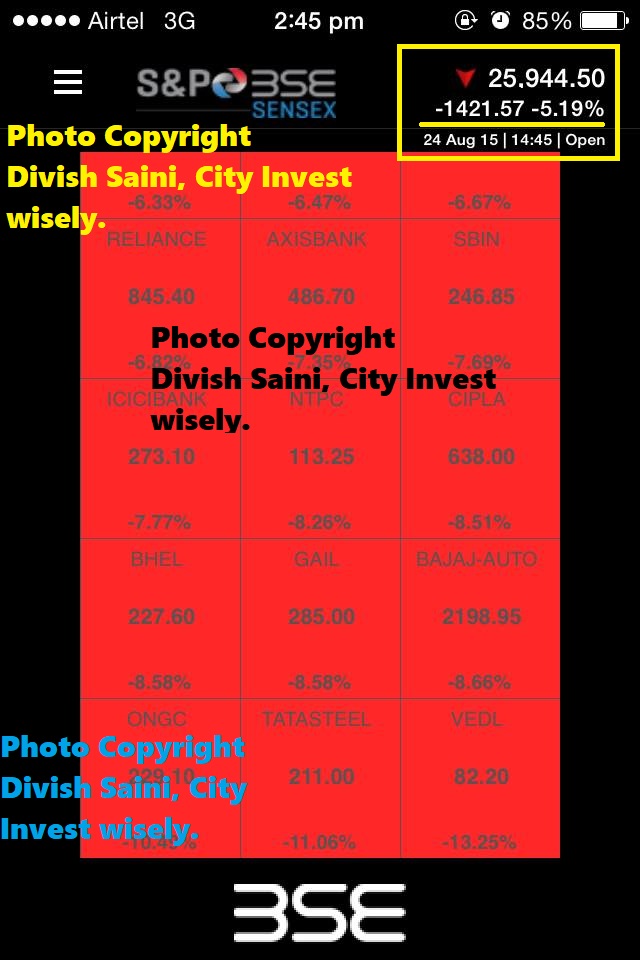
I am still waiting for Panic which I saw on 24th August 2015, that time Index was down 5%, Gut feeling is that, panic phase is near. Many of New traders never saw Heavy fall in Index, Now time is there to witness that in next 2 quarters. Below is the proof of 5% fall in Sensex on 24th Aug 2015. I still remember that day because on that day I booked Heavy profit through options in my trading history on delivery basis and I saved the screenshot.


6 Comments
Again a blockbuster article, very clear explanation with the time correction, especially the increase in the width part in the charts that you have shown, and also how the V shape recovery, is nothing but a trap, again the pictorial real example made it more impactful. Thanks again for crystal clear explanation and always cautioning us before hand in these turbulent times. Last but not the least, reminding us of the single day fall of over 5% in indices is still on the cards!
Thanks 🙂
Hi Divish,
Thanks for sharing this info, this article is eye opener for many small time investors.As per your view I am not going to invest in any share another 2 quarters.
Thanks 🙂
Hi, I’m impressed with the analysis you have described in a very simple way that any novice teader can understand. Hats off, waiting for more articles like this to come in future.
What a gem of an article!!! Using this site from last 2 years but found this today.Great learning as always.Thanks Divishbhai.