
Nowadays Many stocks are running like there is no tomorrow, But all will not sustain Higher levels, Many will give you trap also. Is your Stocks good or Bad ? Here you can check through some process of Technical Analysis. There is no rocket science, You just require some step to check it, In this way we can Identify whether the stock made bottom or not.
Here I am talking about Mid/Small caps Because in last 12-15 months Mid/small caps crashed heavily. Large caps are at higher levels so my main focus is on Mid/small caps. Steps are as follows.
In past 12-15 months there is one panic low in market, Panic low means the time when all shares of market made low, and In Indian market that happened in the month of Sep-Oct 2018 due to NBFC crisis. In Sep-Oct 2018, 98% of stocks made Heavy low so we have to focus on that, this is the first part of process. Panic always mark Bottom but it depends on Individual share, if they recover from Panic low then good otherwise your stock is purely in depression phase. ( A depression phase is that when a stock is only going downwards and all other share are rallying, that happens when fundamental wise stock is weak, Because people prefer good fundamental share while playing shares in rallying market).
Finding of Bottom is very important for a stock, If a stock already made bottom then good for you, If not then more pain will be there in that particular stock, So be-aware of this process while investing in mid/small cap shares. If you want to average your stocks then also this process help you.
- Open Daily candle stick chart, and set chart range from June 2018 to June 2019.
- Check and Mark Sep – Oct 2018 Low ( Main Factor).
- Check and Mark February 2019 Low.
- Find out Highest Level in between Sep – Oct 2018 Low and February 2019 Low.
- If your stock is above that Highet level then good because it already formed bottom, If your stock is below that level then it will take more time for formation of bottom. Check some examples.
Example 1: No sign of Bottom Process in Daawat (LT foods), stock is very weak. 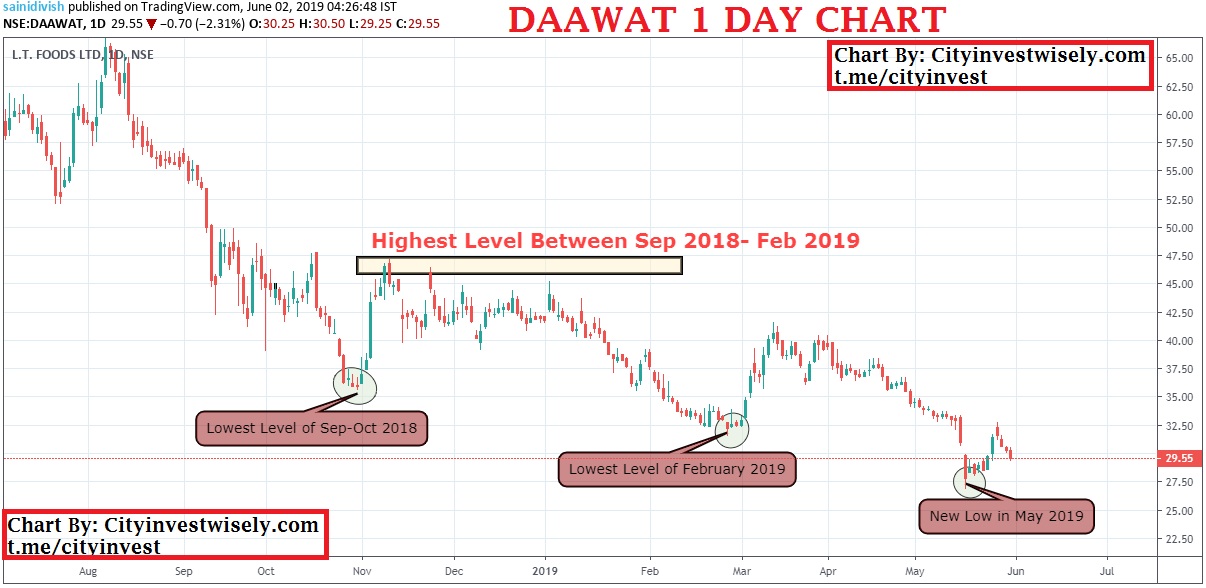
In the above chart Daawat made a new low in May 2019 that means it is one of the weakest stock of market, only 5-10% of Mid/small caps are below February 2019 low and Daawat is one of them. So there is no need to invest anything in these kind of share or no need to average then, atleast wait for some recovery upto 40-42 levels.
Example 2: Bottom Process still going on in Aditya Birla Capital.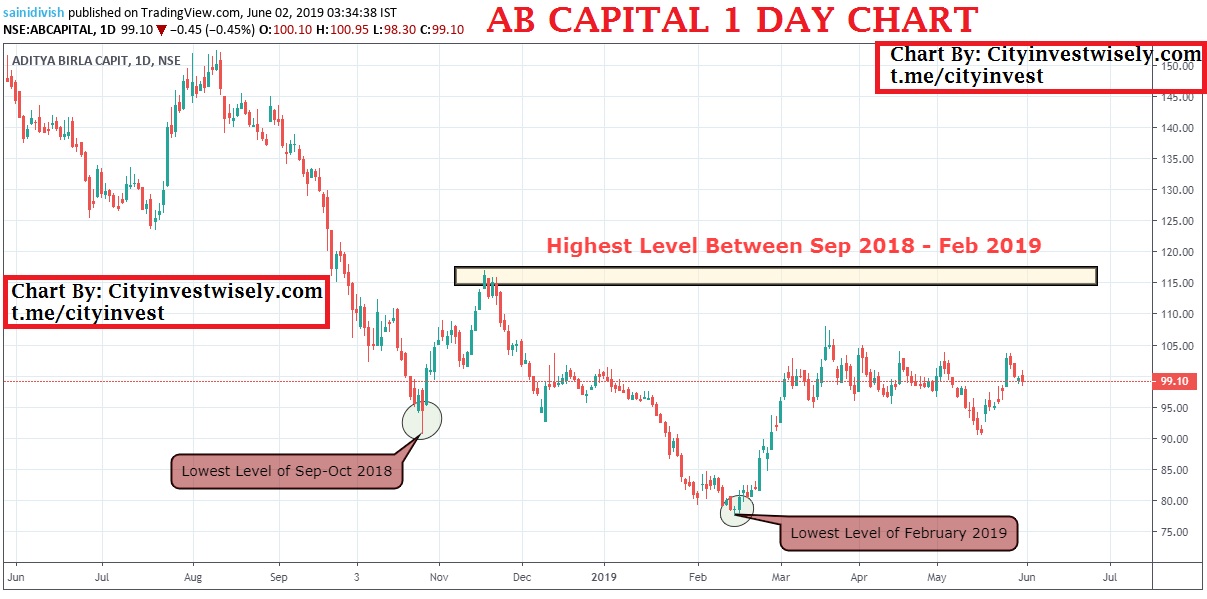 In the above Chart, Price is above Low of February 2019 ( A good point) but Price is still below Highest level of range of Sep-Feb, so there is no buying right now, If you are holding some share and thinking about Averaging, then better to wait for confirmation of Bottom, and that confirmation you get only when price closes above 118 with heavy Volume, Till then wait and watch only.
Example 3: Bottom Process Completed in HDFC Life.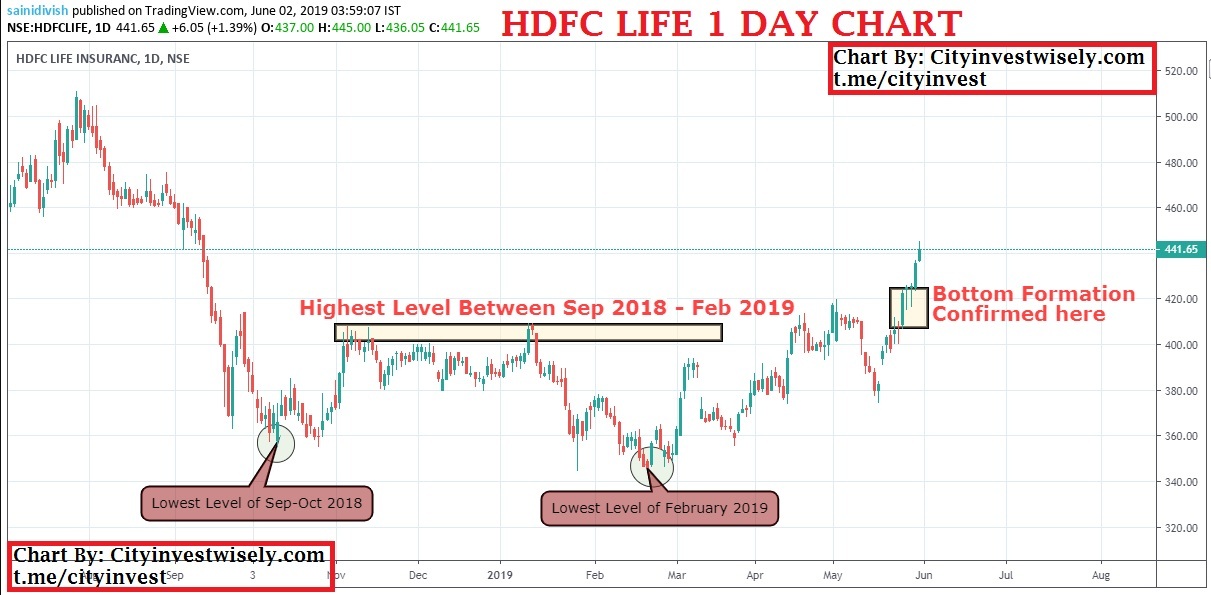
In the Above chart, Price confirmed Bottom Process with Heavy volume and now it is in new trend and in some months it will touch New High.
While checking charts you will get one of the three things:
- Price is below Sep and Feb low and making new low : Stock is purely bearish, Fundamental wise very weak, more lower levels will be there, No need to Invest anything in that, or no need to average them, see example 1.
- Price is between February 2019 low and Highest level between Sep 2018 – Feb 2019, that means bottom formation is near, fundamental wise stock is average ( not so good not so bad), but stock is trying to complete the bottom process, add in your watch-list for potential Breakout. See example 2.
- Price is above Highest Level Between Sep 2018 – Feb 2019 : Stock is good fundamental wise, Bottom process completed, one can Invest or average it and now it will try to touch next resistance, overall consolidation process of last 12-15 completed and now it will start new trend to touch new ATH ( All time high). See example 3.
Many people will say they can easily identify this pattern by checking Lower Low and Lower High, but here I am talking about whole trend reversal of Stock for medium and long term, in this process if Bottom formation is confirmed then price will rally to touch new 52 Week High, Here low of Sep-Oct 2018 is very important to get idea about Bottom Formation, there is big difference Between Sep-Oct 2018 low and all other low points, Because September low is marked by Panic ( NBFC Crisis) not by technical, and all other low points are various legs of technical selling.
If you try to track 10-15 share then surely you will get 5 stocks which already formed Bottom.
Website : www.cityinvestwisely.com
Facebook Page : https://www.facebook.com/cityinvestmentservices
Telegram Equity Channel : https://t.me/cityinvest
Telegram FNO Channel : https://t.me/cityfno
Telegram Equity Group for Discussion : https://t.me/Stocktalkdiv
Telegram FNO Group for Discussion : https://t.me/Fnotalkdiv
Quora : https://www.quora.com/profile/Divish-Saini-2
Twitter : https://twitter.com/gameoftrend


7 Comments
Simple and lucid …nice post!
Thanks
very quick and easy to understand
Thanks
Good informative article. Keep rocks bro
Thanks
Pingback: Is Market Health Really Bad!! Where we are Heading to ? - City Invest Wisely